iDM Applications
Droplet-based microfluidics is used in vast range of applications where droplets are used as micro-reactors to conduct controllable, precise reactions. Currently some of the application fields are drug delivery, cellular studies, material synthesis and chemical reactions. Although microdroplets seem more precise, there is a need to monitor them to ensure the precision.
iDM is a real-time droplet monitoring tool which can be used in different application fields where you have to deal with microdroplets.
iDM is a real-time droplet monitoring tool which can be used in different application fields where you have to deal with microdroplets.
Particle Synthesis
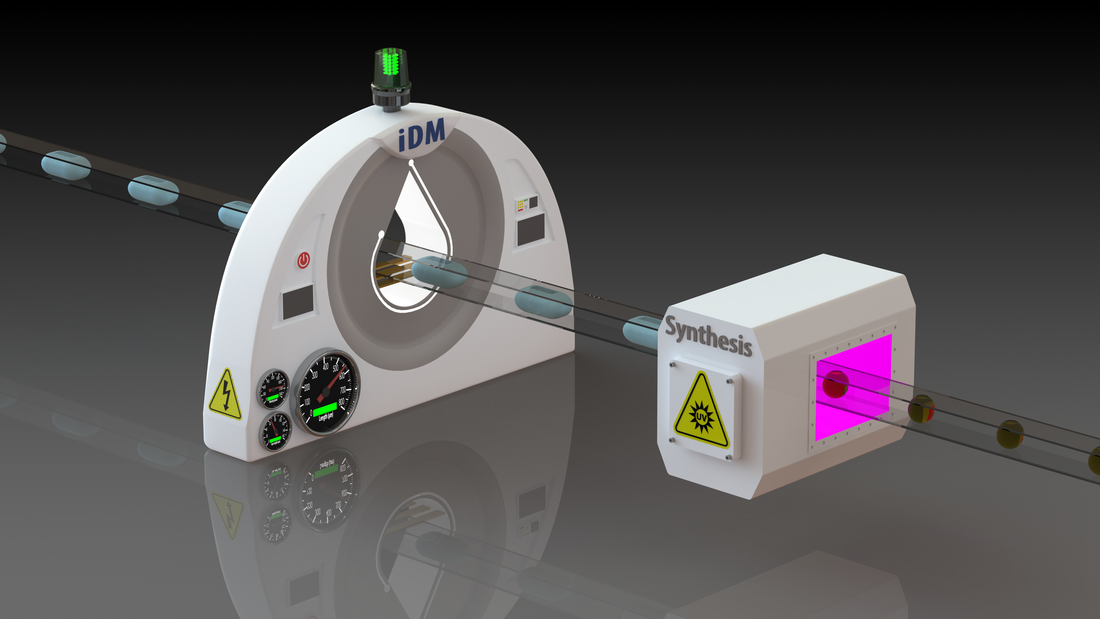
To demonstrate the capabilities of iDM in a compelling application, we have used iDM for real-time monitoring during particle synthesis. Droplet microfluidics has a variety of biochemical applications, one of which is particle synthesis. One of the motivations to synthesize particles using droplet microfluidic systems is to obtain higher monodispersity than emulsion synthesis. However, there is not a tool that gives the size distribution of the particles being synthesized. We have modified the iDM interface so that the real-time particle size distribution can be observed and once a user-defined monodispersity limit is achieved, a green light is turned on the interface to warn the user to initiate the synthesis.
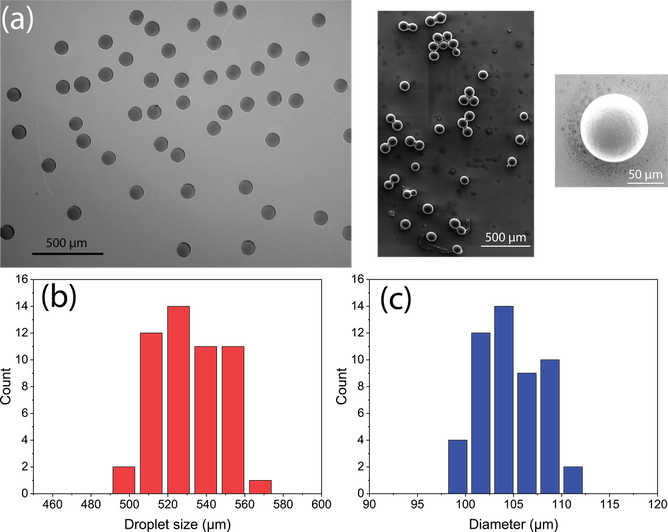
As a demonstration, we have synthesized monodisperse polyethylene glycol (PEG) particles. An aqueous solution of Poly(ethylene glycol) diacrylate together with the photo-initiator (2-Hydroxy-4′-(2-hydroxyethoxy)-2-methylpropiophenone) was prepared, and the continuous phase included mineral oil and span 80 as an oil-soluble surfactant. We added an additional flow of mineral oil before the outlet to increase droplet spacing and prevent droplet coalescence. Microscale droplets were generated and transferred to a petri dish. Then an LED UV gun (Thor Labs, CS2010) was used to cure droplets inside the petri dish. For polymerization, UV exposure (365 nm) for 1 s at 27 W/cm2 power was used. When pressures of the continuous phase, additional flow and aqueous phase were set to 55 mbar, 35 mbar and 51.5 mbar; spherical PEG particles with an average diameter of 106 µm were obtained, as shown in the figure. The spherical shape of the particles was confirmed by the SEM image. The size measurements were performed on the optical microscope image using Digimizer software.
As a demonstration, we have synthesized monodisperse polyethylene glycol (PEG) particles. An aqueous solution of Poly(ethylene glycol) diacrylate together with the photo-initiator (2-Hydroxy-4′-(2-hydroxyethoxy)-2-methylpropiophenone) was prepared, and the continuous phase included mineral oil and span 80 as an oil-soluble surfactant. We added an additional flow of mineral oil before the outlet to increase droplet spacing and prevent droplet coalescence. Microscale droplets were generated and transferred to a petri dish. Then an LED UV gun (Thor Labs, CS2010) was used to cure droplets inside the petri dish. For polymerization, UV exposure (365 nm) for 1 s at 27 W/cm2 power was used. When pressures of the continuous phase, additional flow and aqueous phase were set to 55 mbar, 35 mbar and 51.5 mbar; spherical PEG particles with an average diameter of 106 µm were obtained, as shown in the figure. The spherical shape of the particles was confirmed by the SEM image. The size measurements were performed on the optical microscope image using Digimizer software.
The coefficient of variation (CV) for 50 PEG particles obtained from optical images was 2.8%. This value is very close to the CV of droplet size (L+2CL) measured by iDM as 3.3%. Two histograms were given in the same figure: for droplet size distribution obtained by iDM and for polymer sphere diameter obtained by optical microscope image analysis. The similarity between the histograms also confirms the iDM results. During photo-polymerization, we observed a diameter shrinkage of 53%.
Response Time
To demonstrate the use of iDM for real-time droplet formation analysis, we compared the response time of systems driven by syringe pump and pressure pump. Unarguably, syringe (displacement) and pressure pumps are the two most commonly used pumps in microfluidic systems.
It is shown that syringe pump has periodic fluctuations mainly due to the stepper motor which pushes the plunger. Flow fluctuations also affect pump response time that leads to various response times ranging from about two minutes to nearly one hour, reported by different studies. Pressure pump has generally yielded a better performance in terms of response time and flow fluctuations in comparison with syringe pump. Deciphering the cause of parameters affecting the response time of the system remains difficult due to lack of a real-time analysis tool.
It is shown that syringe pump has periodic fluctuations mainly due to the stepper motor which pushes the plunger. Flow fluctuations also affect pump response time that leads to various response times ranging from about two minutes to nearly one hour, reported by different studies. Pressure pump has generally yielded a better performance in terms of response time and flow fluctuations in comparison with syringe pump. Deciphering the cause of parameters affecting the response time of the system remains difficult due to lack of a real-time analysis tool.
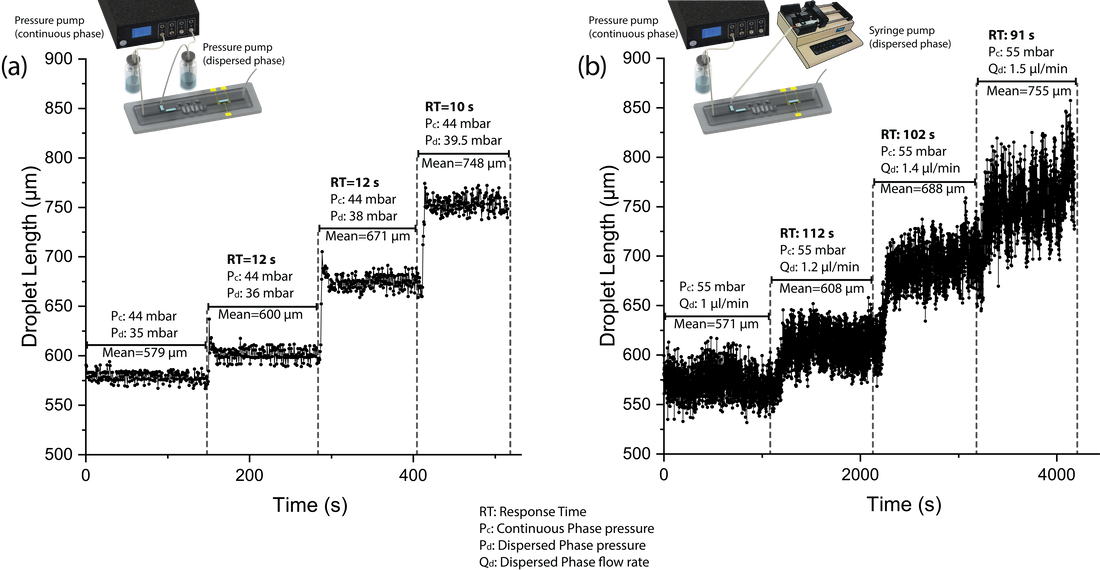
For the comparison of the response time, we used a high-end syringe pump (KDScientific 270) and pressure pump (Elveflow OB1). The schematics of the two setups are given in the figure. For ease of comparison, we supplied the continuous phase using the pressure pump for both experiments. For the first scenario, the dispersed phase was introduced using a pressure pump. The droplet size was modified by gradually increasing the pressure levels (Pc, Pd) that gave a step-wise droplet length response as a function of time, as shown in part (a) of the figure. The corresponding pressure levels and the mean droplet length for each setting is displayed on the figure. For each level, we formed 200 droplets and measured their length in real-time using iDM after which the input pressure levels are changed. As seen from these results when a pressure pump is used the response time is measured as around 12 s, for a system with approximately 1 Hz droplet generation rate.
A similar experiment was performed when the dispersed phase was supplied by the syringe pump. The continuous phase pressure (Pc) was kept fixed at 55 mbar, whereas the syringe pump flow rate (Qd) is increased gradually from 1 to 1.5 µl/min to match the droplet lengths obtained in the first experiment. As seen from the results given in (b) part of the figure, we observed an order of magnitude increase in the response time, which is around 100 s. It is important to note we analyzed more than 1500 droplets at each setting due to much longer response time of the syringe pump.
We have obtained similar results using two other models of syringe pumps and concluded that response time of syringe pumps are markedly lower than the pressure pump.


