iDM Requirements
iDM is developed using LabVIEW 2017, which would require LabVIEW run engine (it is suggested to use LabVIEW recommended system configurations.) to run the iDM.
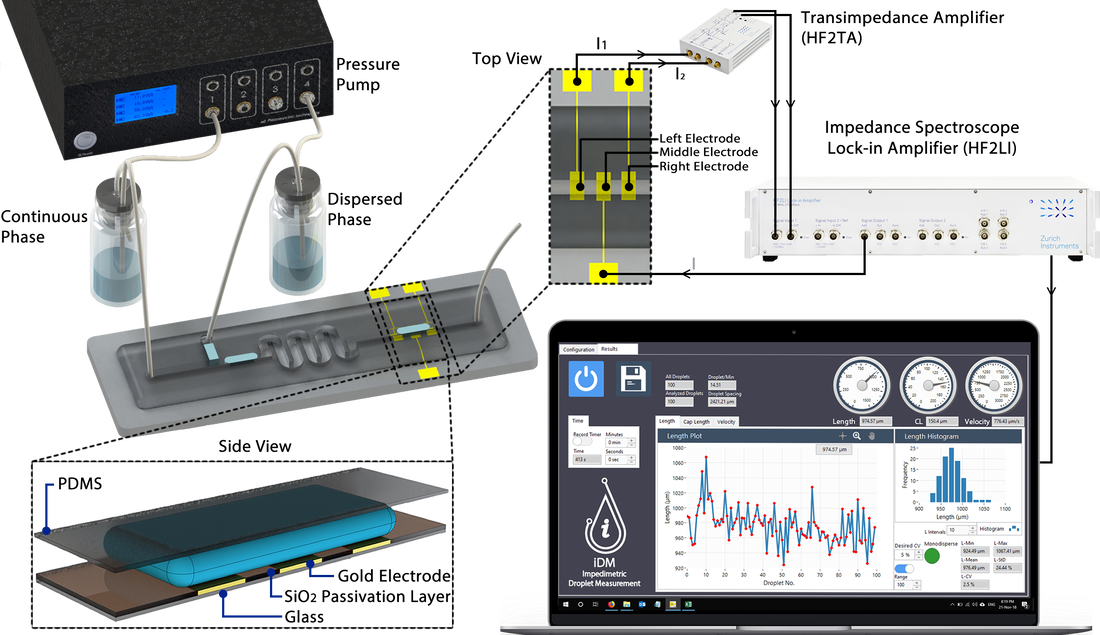
HF2LI lock-in amplifier (Zurich Instruments) is required to obtain the impedimetric signal.
Clean-room facility is needed to produce a microfluidic chip equipped with electrodes.
Note: Fabrication techniques are based on standard lithography techniques.
HF2LI lock-in amplifier (Zurich Instruments) is required to obtain the impedimetric signal.
Clean-room facility is needed to produce a microfluidic chip equipped with electrodes.
Note: Fabrication techniques are based on standard lithography techniques.
Setup Required for iDM
How to use iDM
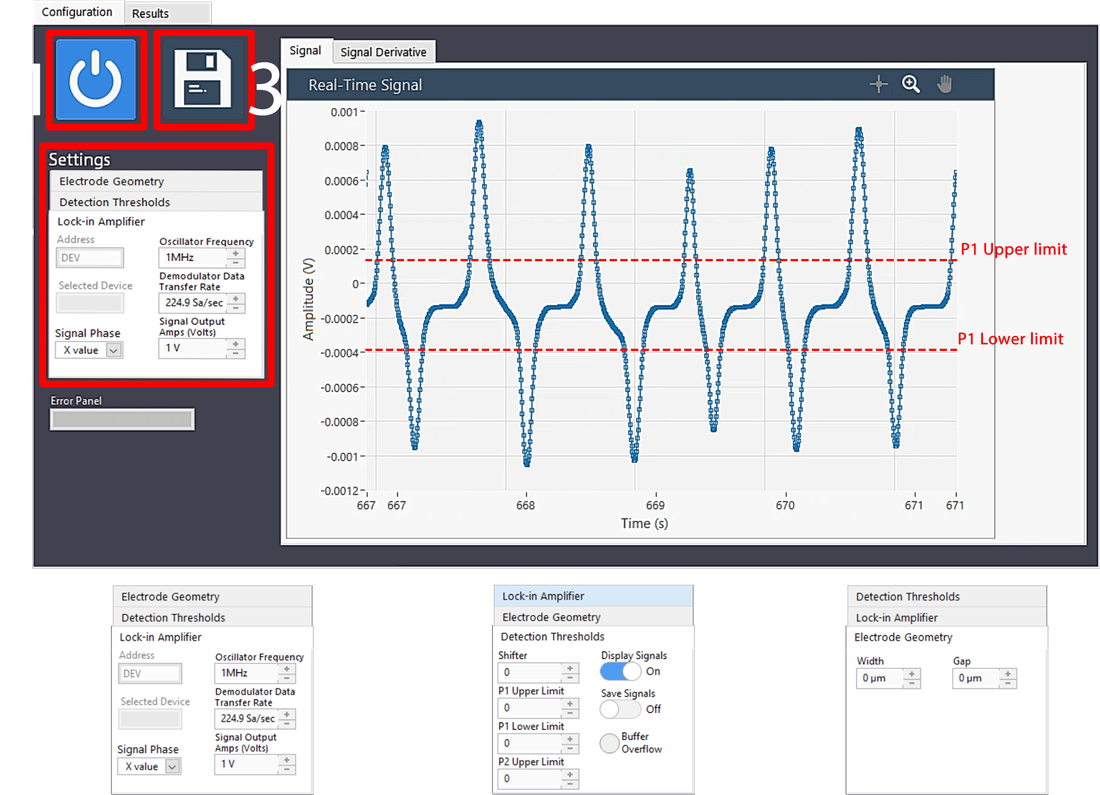
1. Press ‘Start’ button to start iDM program and wait for several seconds until making connection between software and lock-in device.
2. Under ‘Settings’ tab you have to set several parameters as following:
3. Press ‘Save’ button to start droplet analysis.
2. Under ‘Settings’ tab you have to set several parameters as following:
- 2.1. Initially, lock-in oscillatory frequency, data transfer rate, impedance component of the signal, and applied voltage amplitude can be set under ‘Lock-in Amplifier’ tab. Default values of each are set as depicted in Figure 2.1.
- 2.2. The second part to set is the ‘Detection Thresholds’. To maintain the signal base at zero, there is a shifter that should be set. Determining the value needed to be shift is a rough estimation that can be done intuitively and doesn’t require precise measurement. The next things to determine are ‘P1 Upper Limit’, ‘P1 Lower Limit’, and ‘P2 Upper Limit’. Red dashed lines in the figure, illustrates the rough approximation of each threshold. ‘P2 Upper Limit’ should be set similar to the ‘P1 Upper Limit’ from ‘Signal Derivative’ part.
- 2.3. Finally, electrode geometry should be determined.
3. Press ‘Save’ button to start droplet analysis.
iDM Results
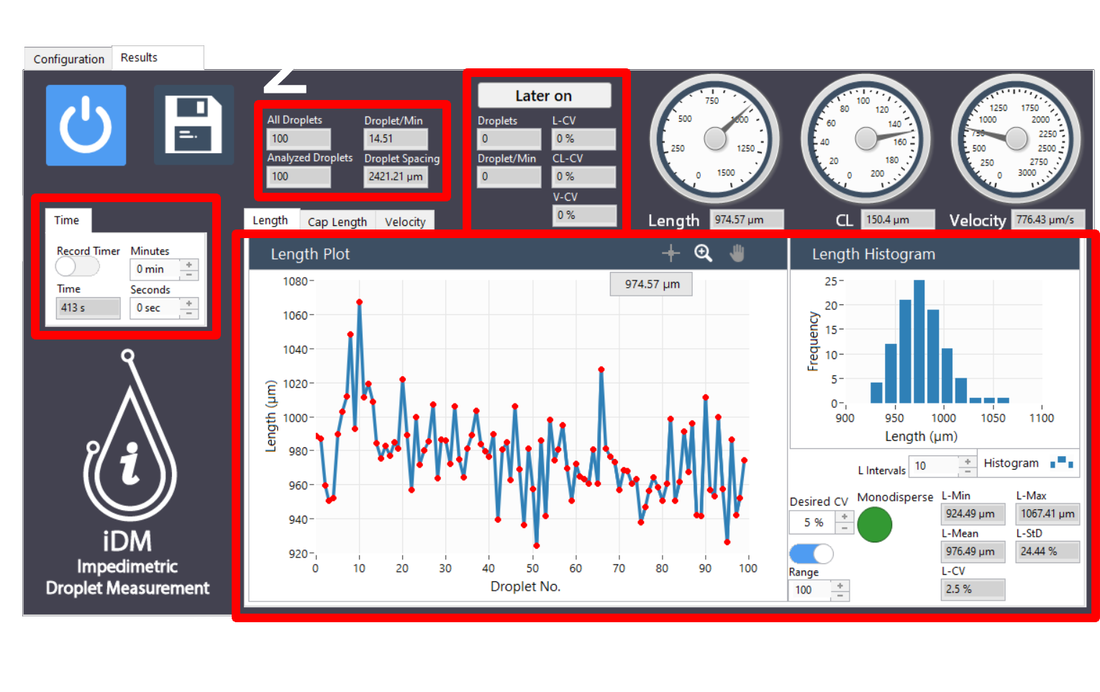
Under the ‘Results’ tab you can find the following:
1. In this part, ‘Time’ activates automatically and shows the time (s) passed as data recording starts. The next option, ‘Record Timer’, is to adjust the specific time to stop data recording.
2. This section shows number of all droplets and successfully analyzed ones since data recording. Further, droplet frequency and the average spacing between droplets are calculated and shown.
3. The third section is the main monitoring panel of the iDM for droplet length (L), cap length (CL), and velocity (V). Each property has its own specific tab, which is switchable.
4. While you are recording data, section 2 and 3 shows different droplet properties since data recording started. Sometimes it is needed to monitor overall droplet properties with new ones simultaneously. Section 4 is designed to meet this need! Whenever you press the ‘Later on’ button, the latest droplet properties will be monitored in this section. You can also stop this feature without touching data recording and if you restart the feature again, it will clear the latest properties and restart monitoring the latest droplets.
1. In this part, ‘Time’ activates automatically and shows the time (s) passed as data recording starts. The next option, ‘Record Timer’, is to adjust the specific time to stop data recording.
2. This section shows number of all droplets and successfully analyzed ones since data recording. Further, droplet frequency and the average spacing between droplets are calculated and shown.
3. The third section is the main monitoring panel of the iDM for droplet length (L), cap length (CL), and velocity (V). Each property has its own specific tab, which is switchable.
- 3.1. Property plot and its histogram are plotted in real-time and they can be exported into different formats by right-clicking on each plot and selecting ‘Export’. In the property plot section, activating the sliding-button of the ‘Range’ will show the latest range of data that is determined by the user. Further, you can change histogram bin intervals in real-time. Note that all these properties can be changed while the program is running and they will change after a new droplet has been recorded.
- 3.2. In ‘Desired CV’ section user determines the coefficient of variation (CV) of droplet length and the light will turn green if the analyzed data CV is less than determined one.
- 3.3. In the bottom-right part of this section, minimum, maximum, mean, standard deviation (Std) and coefficient of variation (CV) for each property are monitored.
4. While you are recording data, section 2 and 3 shows different droplet properties since data recording started. Sometimes it is needed to monitor overall droplet properties with new ones simultaneously. Section 4 is designed to meet this need! Whenever you press the ‘Later on’ button, the latest droplet properties will be monitored in this section. You can also stop this feature without touching data recording and if you restart the feature again, it will clear the latest properties and restart monitoring the latest droplets.
iDM Demo
Here you can find a short tutorial video of running iDM:


